
The Strategic Challenge
Data volume was not the communication problem. Confidence was.
Executive teams do not need another tour of platforms, pipelines, or governance terminology. They need to know why a critical number changes between teams, who owns its definition, whether it can be traced to its source, and how quickly the organization can answer a board-level question with confidence.
- A plain explanation of why conflicting metrics create business risk
- A governance model leaders could understand in one pass
- A visible connection between data quality and decision speed
- A first move concrete enough to authorize
- A platform-first story that reads like a technology purchase
- Dense architecture diagrams built for specialists
- Governance language with no executive consequence
- A transformation roadmap too broad to prove value quickly

Trust as an Operating Outcome
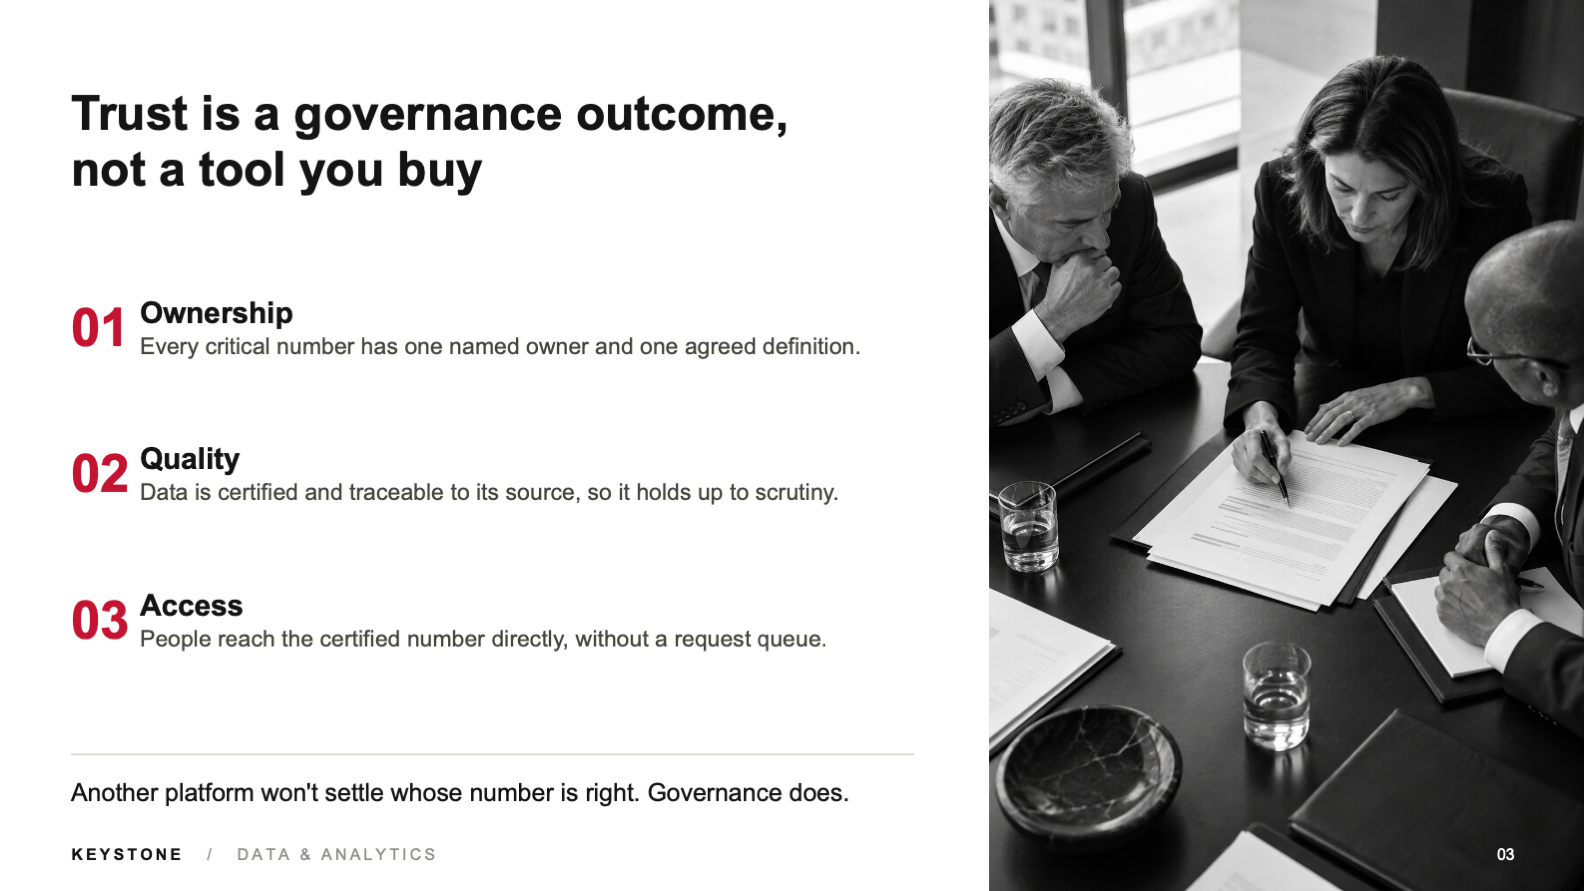
The strategy reframes governance around three conditions a decision-maker can test: ownership, quality, and access.
Every critical metric needs a named owner and one agreed definition. It needs to be certified and traceable to its source. The people making decisions need direct access to that certified number without entering a request queue. Together, those conditions make trust operational rather than aspirational.
One owner and one agreed definition end the negotiation between teams.
The metric holds up under scrutiny because its lineage and quality checks remain visible.
Leaders can reach the certified number directly instead of waiting for a custom answer.
The organization can decide without reopening the argument over whose number is right.
One Trusted Path From Source to Decision
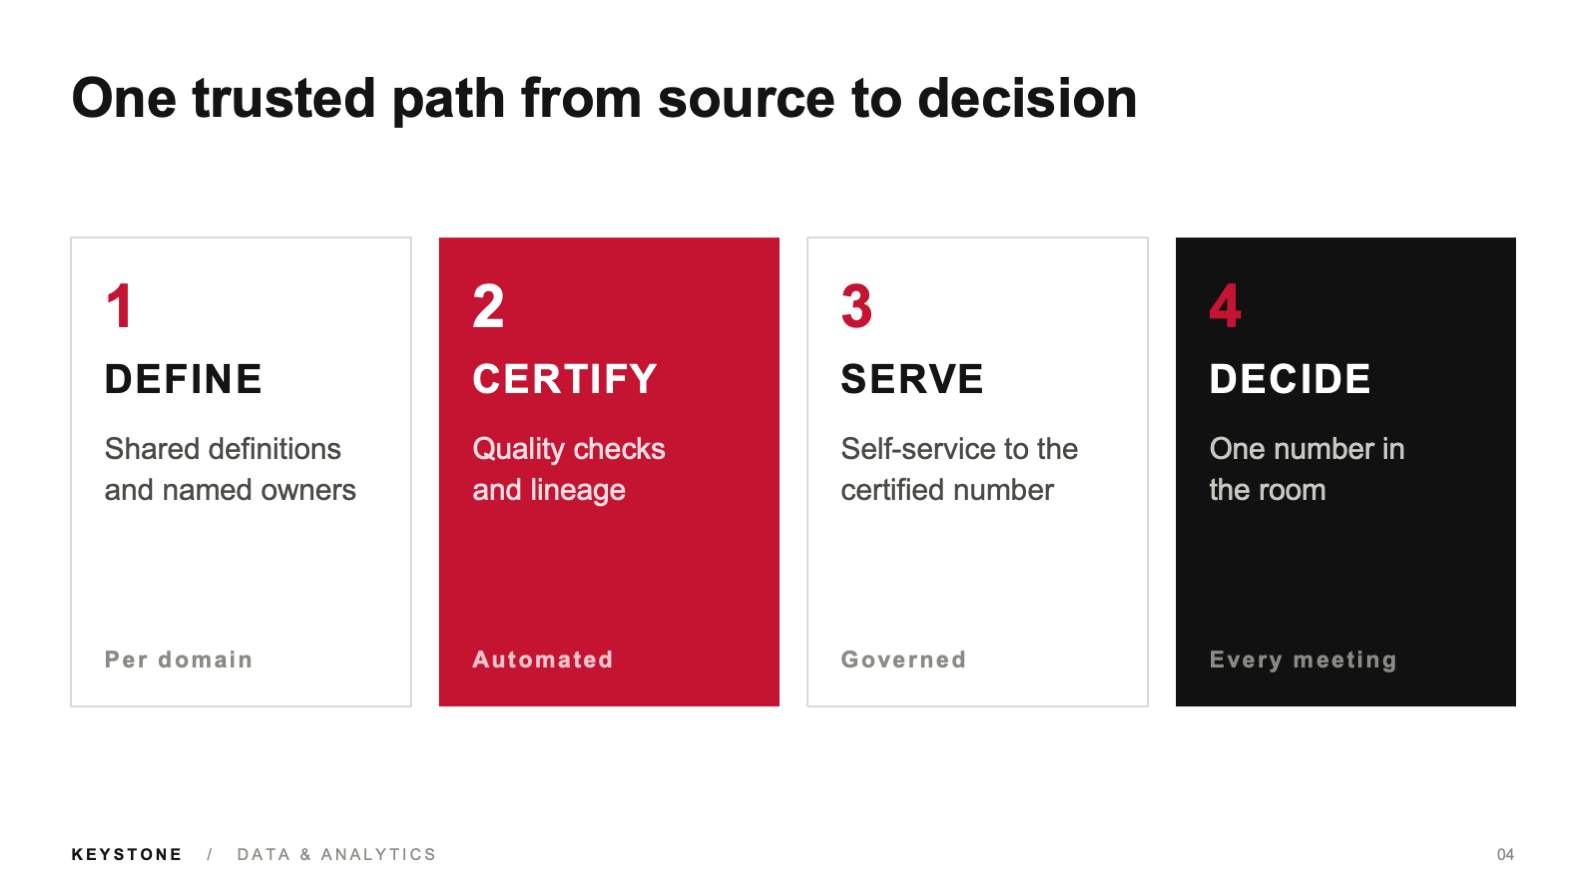
The operating model compresses the strategy into four moves the audience can remember and the organization can repeat.
Agree on the metric, its meaning, and the person accountable for it.
Automate the checks that establish whether the number can be trusted.
Make the certified number available directly to the people who use it.
Bring the same governed metric into every meeting where the decision gets made.
The First 100 Days
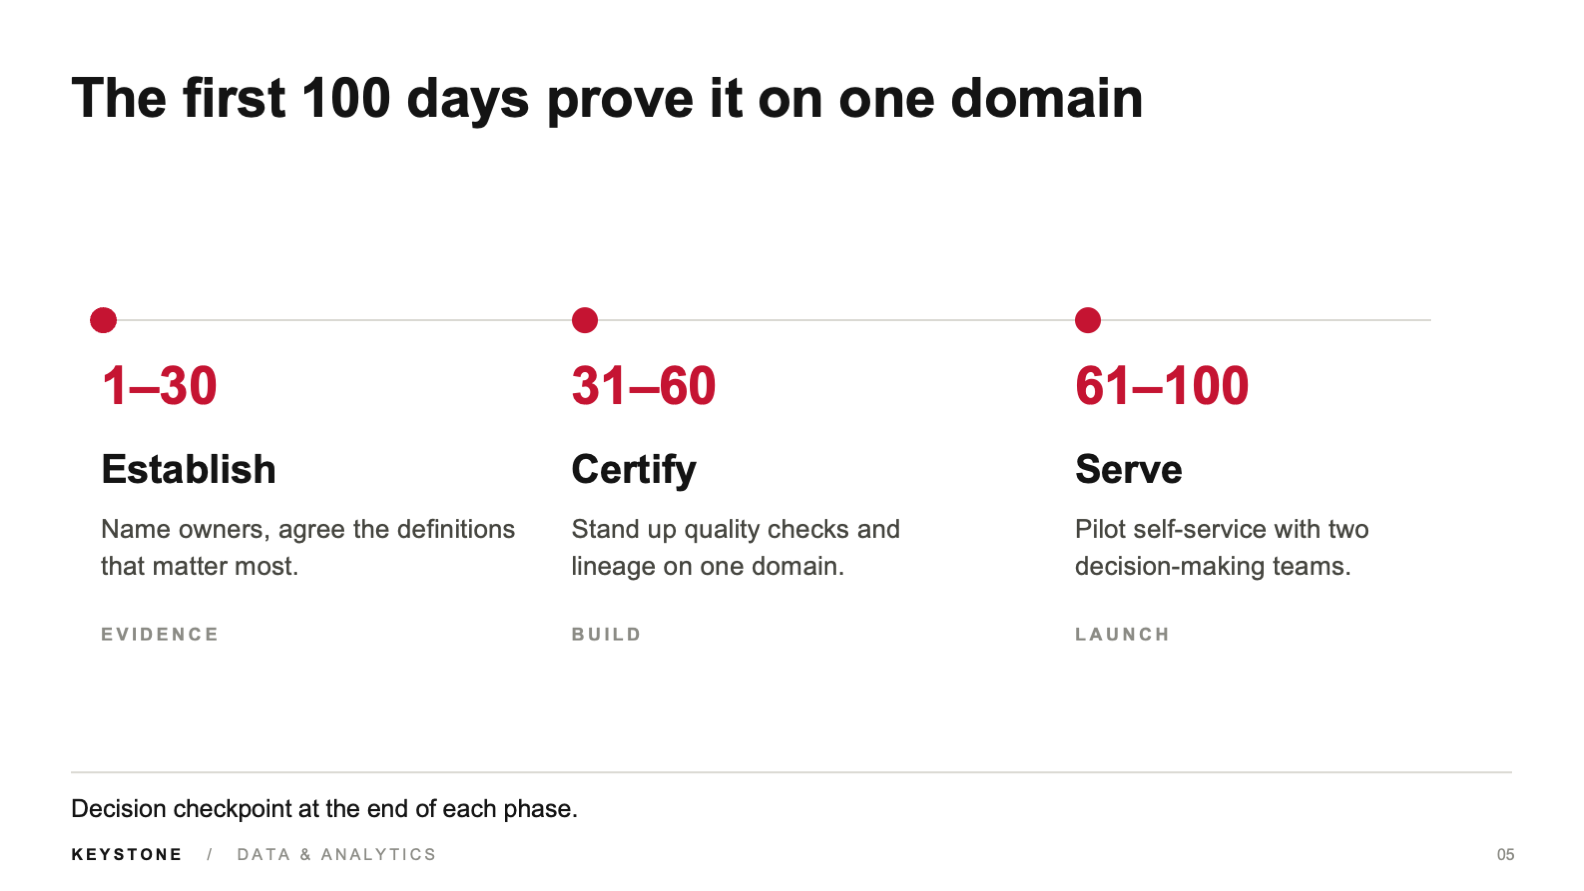
A strategy gains credibility when the first proof is small enough to launch and important enough to matter.
The roadmap avoids an enterprise-wide transformation promise. It starts with one critical domain, names the measures that will prove value, and adds a decision checkpoint after each phase.
Establish
priority domain
definition set
Certify
quality standard
lineage path
Serve
pilot teams
launch decision
A Visual System Built for Authority
The design needed to feel contemporary enough for a data leader and restrained enough for a financial boardroom.
Black, white, and graphite create institutional credibility. Crimson identifies the moments that matter: the board question, certification, performance targets, and the next decision. Editorial photography introduces consequence without relying on decorative technology imagery or unreadable dashboards.
Large headlines, open space, and selective imagery let each point land before the detail.
The accent color carries decisions and proof rather than appearing as decoration.
The photography shows leaders moving from ambiguity toward clarity.
The monochrome system feels confident and premium without competing with the argument.
What the Design Achieves
The deck turns an abstract data ambition into a proposition an executive team can evaluate, remember, and authorize.
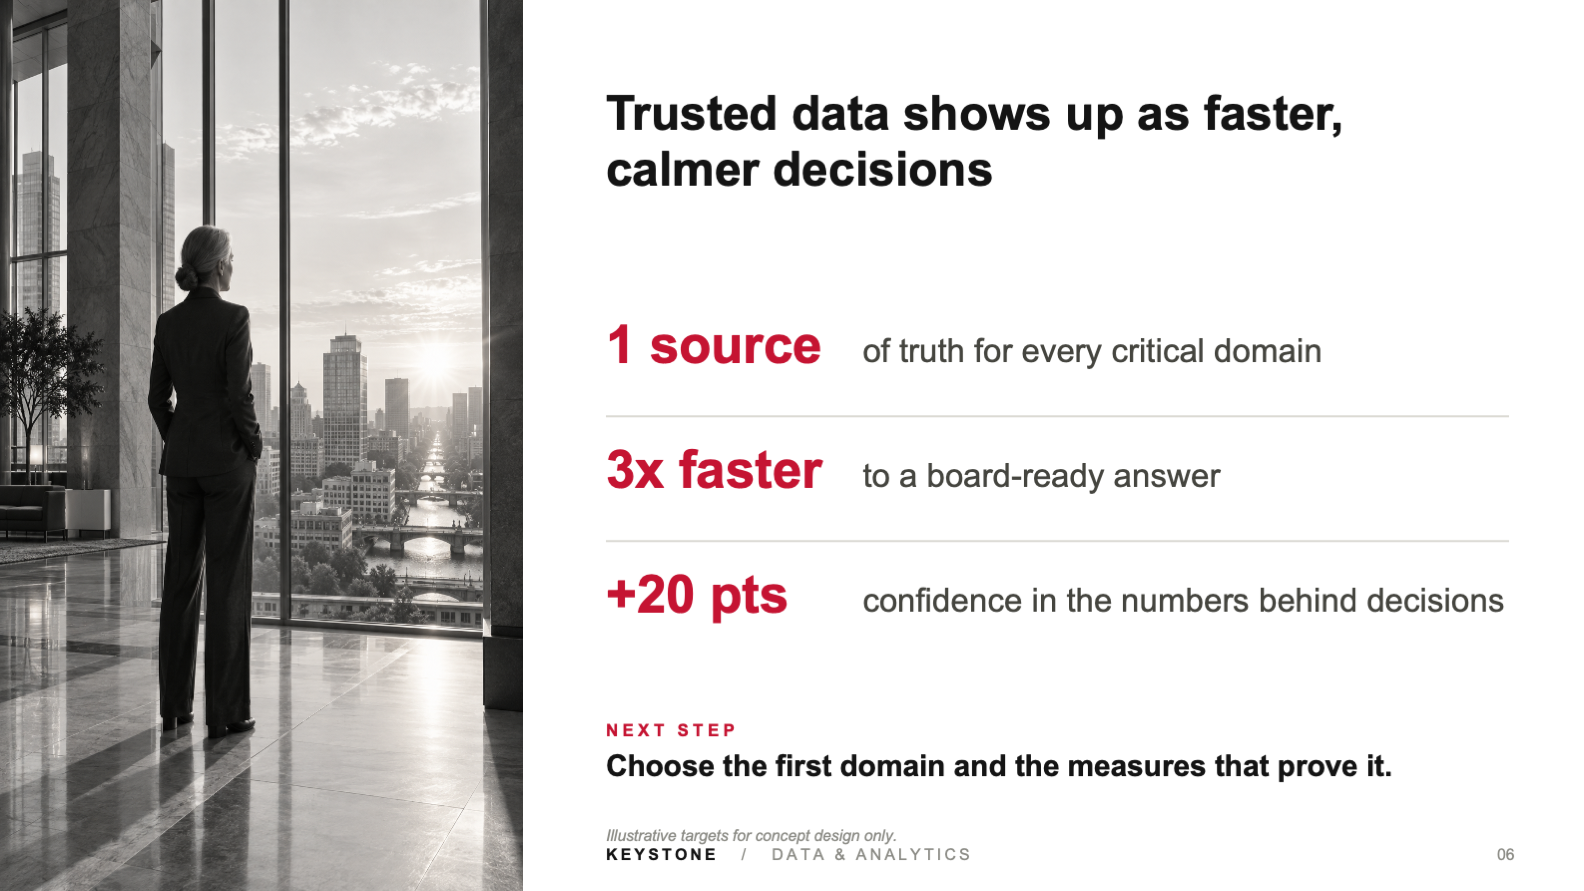
The close returns to the business outcome: one trusted source for each critical domain, a faster path to a board-ready answer, and greater confidence in the numbers behind the decision. The figures shown are illustrative targets for concept design, not reported client results.
- A concise narrative from business problem to first pilot
- A governance model framed in language leaders can use
- A repeatable operating path from definition to decision
- A 100-day plan with explicit checkpoints
- A closing decision that tells the room what to do next
- Executive storytelling for a complex enterprise topic
- Translation of governance concepts into decision language
- Information architecture built around one argument
- Financial-services tone and visual judgment
- Presentation design that connects strategy to execution